2018 Central Farm Service Corn Yield Tour
Sep 24, 2018
2018 Central Farm Service Corn Yield Tour
As we have done in the last few years, Central Farm Service has done a Pro Farmer/Farm Journal type of yield tour on corn fields in our area. When we first started doing this tour in 2012 we walked fields in mid to late August. In recent years we have pushed the tour back into September to get a better look at stalk quality, standability/harvestability, as well as the potential impact of a frost or other weather event on yield and test weight.
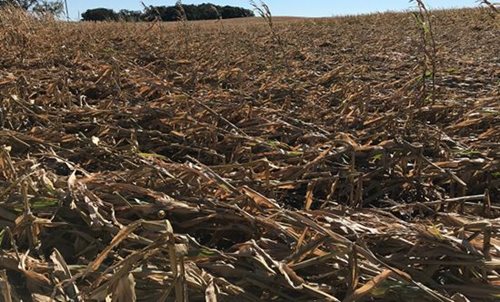
The tour was completed September 15-20th, with daily high temperatures in the mid to upper 80°F’s for the first few days and cooling down after Monday. On Monday we were still warm to very warm, but by late morning to early afternoon we had a cold front move through that dropped the temperature 20-30°F, accompanied by sustained winds of 30-40MPH, that did cause some tops of corn to break off and in some cases stalks to break 4-12” above the soil surface.
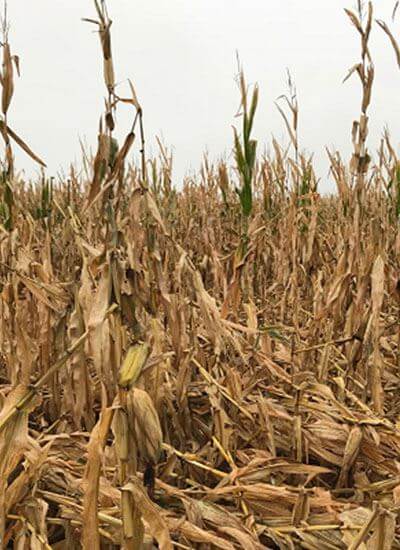
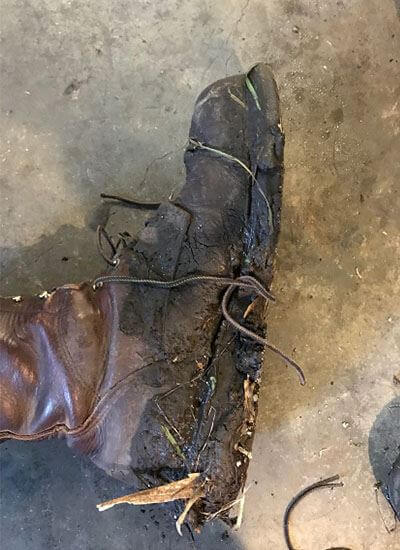
On Thursday September 20, late in the day we had several Tornadoes and straight-line winds that hit our area. These weather events caused catastrophic damage to many door yards and bin sites that will affect producer’s ability to dry and store their crops this harvest season.
The damage from Thursdays storms caused additional plants to break off and or blow down. This damage, as well as debris from the storm landing in fields, will slow harvest down further.
Standability issues may become more of a concern the later into harvest we get. It is my belief that many of these standability issues can be traced back in some part to compaction issue that we created the last few years in the fall while harvesting, as well as in the spring, planting in less than ideal conditions. These compacted soils are more apt to have additional nutrient deficiencies, due to the corn plants inability to penetrate deeper into the soil profile to access nutrients. These deficiencies cause cannibalization of stalks and leaves to start which takes nutrients from the stalk and leaves and moves them into the ear and kernels. Additional factors that may affect standability this fall are:
- Diminished root system due to frequent rainfall amounts that allowed the plant not to have to grow deeper into the soil profile in search of water
- Cloudy/Hazy days after pollination from clouds, or smoke from wildfires in Canada or western states, which reduced photosynthesis, may have forced the plant to cannibalize the stalks sooner
- Diseases such as Northern Corn Leaf Blight, Gray Leaf Spot, Physoderma, and Rusts
- Insects like Leaf Minors cause and entry point for disease to enter
- Good yield potential which will cause the plant to cannibalize the stalk and leaf surface area to fill the kernels
- High wind and hail events which have caused some Goosenecking and root lodging as well as bruised stalks
- Nutrient deficiency caused by previous high yielding crops removing nutrients, and those nutrients not being replaced by manure or fertilizer or the reduction in the amount of manure or fertilizer that was applied.
- Soil pH issues either too high or too low will cause nutrient deficiencies
Individual ear/kernel count yield estimates ranged from 97.14 bu/acre on the low end of the spectrum to 298.01 bu/acre on the high end. The lowest field average is 139.12 and the highest adjusted field average is 228.8 bu/acre.
The average of all adjusted yields for 2017 is 192.78 bu/acre, which is 4.10 bu/acre less than the 2017 adjusted yield of 199.66 bu/acre.
| 2017 Adjusted Yield | 2018 Adjusted Yield | Difference |
| 196.88 | 192.78 | -4.10 |
One of the factors that made the 2017 corn crop yield as good as it did was a longer fill period in September and part of October that pushed test weights higher. In looking at the quality of kernels and how early the vast majority of the corn plants died, I do not see test weights and grain quality being as high or as good as 2017.
Listed below is the comparisons for Adjusted Yield by year, as well as the number of stops that the yield tour made for the season. It is always interesting to see from an historical perspective what yields have done, and the number of stops that were made during the tour.
| Year | Adjusted Yield | Stops | ||
| 2018 | 192.78 | 48 | ||
| 2017 | 196.88 | 65 | ||
| 2016 | 199.66 | 52 | ||
| 2015 | 199.56 | 34 | ||
| 2014 | 188.44 | 33 | ||
| 2013 | 180.86 | 34 | ||
| 2012 | 187.6 | 30 |
The initial consensus from the tour is that we will have good yields this fall, but with the expectation that we will be 5-15 bushels less than last year, due to wetter soil conditions that slowed planting this spring, compaction, and disease. In looking at fields after our storm events initial estimates are that we will experience a negative 20-50 bushel impact compared to 2017.
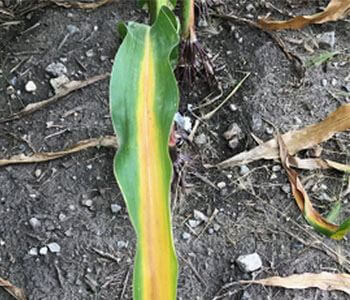
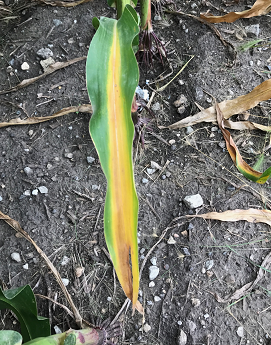
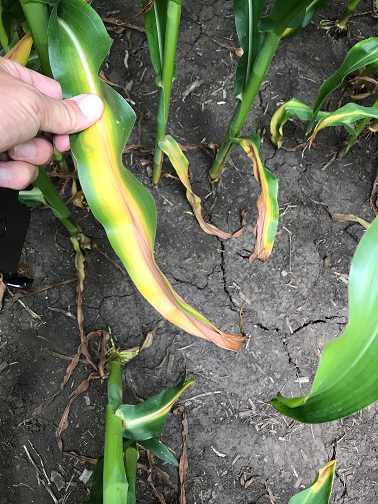
Other concerns affecting yield are mobile nutrient deficiencies such as Nitrogen and Sulfur. We started to see Nitrogen deficiencies as early as mid-July and once they start to show up they continue to advance up in the plant, from the bottom leaf up, until the plant is dead. The photos below show Nitrogen deficiency from mid/late July.
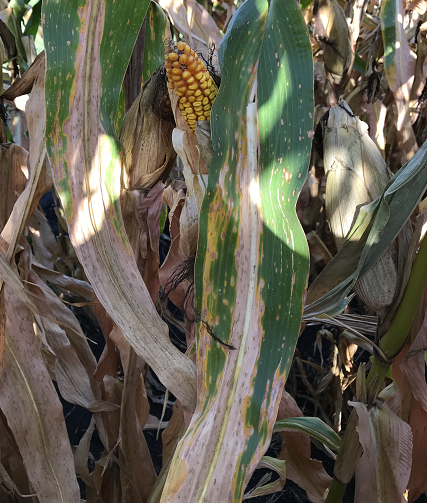
The photos below show Nitrogen deficiency in plants close to black layer or Physiological Maturity (R6). I do not like to see corn plants with leaves that have nitrogen deficiency at the ear or above the ear prior to R6. I want the 2-3 leaves below the ear to be green and show no Nitrogen deficiency prior to R6. Nitrogen deficiency this high in the plant prior to R6 may cause the rate of cannibalization to increase, which will in turn reduced the standability of the corn plant.
An additional nutrient deficiency that started to show up at the end of the season but is tough to photograph is Sulfur deficiency. Sulfur deficiency starts at the top of the plant and starts to work its way down. Much like late season Nitrogen deficiency, Sulfur deficiency increases cannibalization, which in turn affects standability.
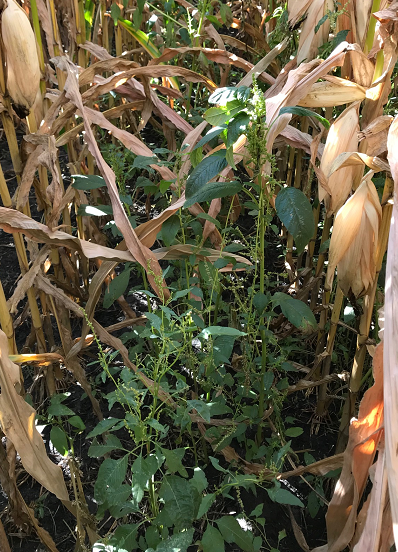
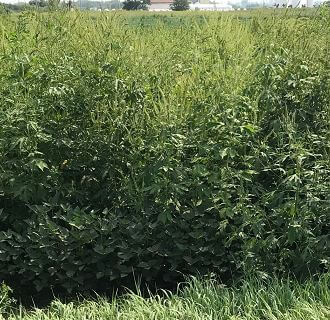
Another yield limiting factor that was more prevalent this year, than in years past, has been reduced weed control.
We saw reduced control of both grass and broadleaf species in many fields during the tour. This has not normally been the case in the history of the tour, but we started to see more of it in 2017. Potential causes:
- Reduced rates of herbicides and adjuvants and did not have an adequate rate or coverage on targeted weeds which reduced control
- Utilized products formulated with less than adequate rates of Active Ingredients to kill targeted weeds such as Waterhemp species, Giant Ragweed, Velvetleaf and Foxtail species in an attempt to be reduce costs
- Late Herbicide or No Herbicide application due to wet field conditions
The 2018 Central Farm Service Corn Yield Tour had a goal of 55 stops and ended up with 48 stops for the year. The area covered was from Odin and St. James on the western end, and then proceeding at a northeasterly direction towards Mankato, with the far northeasterly stop being in the Hastings Minnesota area. The eastern border of the tour was from Hastings Minnesota down to Cannon Falls, Kasson and with the far southeastern stop being Brownsdale Minnesota. The southern border ran from Brownsdale to Austin, Hayward angling southwesterly towards Bricelyn and then northwesterly to Blue Earth, Granada and back to Odin.

